

Data Team Updates

Data Team Member
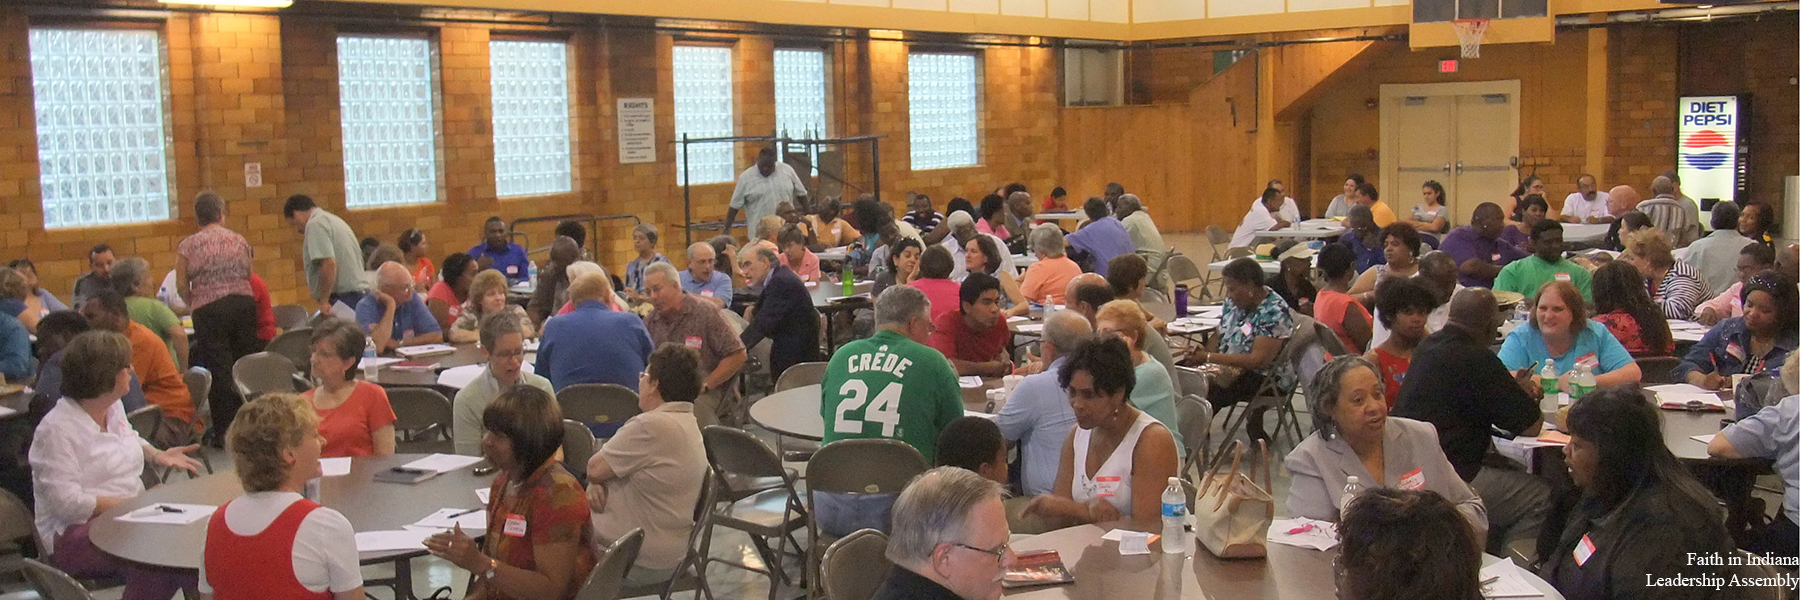
When I first joined the Observing Civic Engagement Lab (OCE), I began as an observer, attending convenings and documenting what I saw. At the time, I was solely focused on collecting accurate observations and did not think much about what happened to the data afterward.
That changed when I joined the data team, which allowed me to see another side of the process and understand what happened after observations were collected. As a cybersecurity student, I found this especially interesting. I am accustomed to thinking about data in terms of security, including how it is protected, who has access to it, and how its integrity is maintained. Working with OCE gave me the perspective of working directly with real research data and seeing how information could move from an observation to something useful for an organization.
One of my first tasks on the data team was working with the analytic software Stata to create graphs from OCE data. There was definitely some trial and error in the beginning. I had to learn more than just how to run the code; I also had to check organization codes, look at observation counts, and ensure the graphs were showing the correct information. This led to the creation of 119 organization-specific data reports. My role included working on the PDF design, writing data descriptions, and helping automate the organization's information into reports. I also worked with the team on individual variables that were included in the reports.
Seeing all 119 reports come together was meaningful because it represented my journey from sitting in a room and collecting observations to helping turn that information into something that could be shared with the observed organizations. I also found that I enjoyed troubleshooting. When something did not look right, I had to locate the problem, test different solutions, and determine the cause—a process that felt familiar due to its close connection with cybersecurity. Both areas require attention to detail and understanding outcomes rather than simply assuming everything is working correctly.
This experience has changed the way I look at data. Now, when I see a row in a dataset, it does not feel like just another row. I know there was a real observation behind it, in a real room, involving a real community organization. Experiencing different parts of that process, from observation to working with the data and helping create the final reports, has given me a much better understanding of how meaningful data can be when it is handled carefully.
Some fun stats
We’ve observed over 162,000 participants across more than 4,500 convenings.